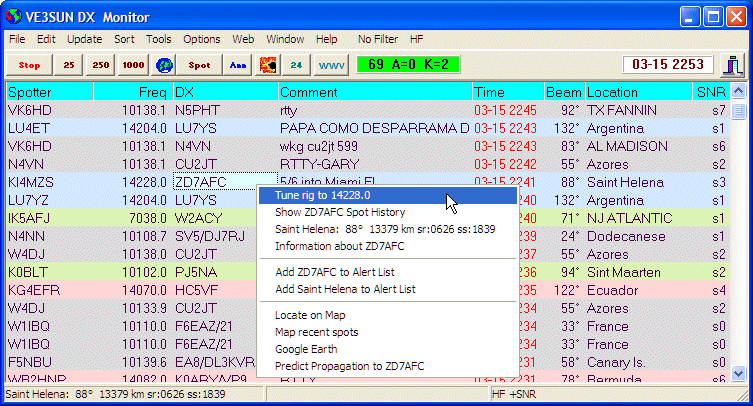
DX Monitor Main Grid Window
DX Monitor Main Window
The main window is the control center for DX Monitor where incoming spots are displayed in a grid. Buttons on the toolbar simplify some of the tasks the program can perform. The grid can be sorted on any column and information displayed in the other windows by clicking, double-clicking or right clicking for the popup menu.

DX Monitor Main Grid Window
Spotters highlighted in red are local to the user. DX highlighted in red is on your Alert List.
Press the AUTO button to begin automatic operation. Optionally, if selected in the Update Menu, DX Monitor will download spots from DX Summit and the HB9DRV web cluster. If it appears that more spots are needed since the last time DX Monitor was run, it will download 250 and then 1,000 spots from DX Summit. More spots can be downloaded using the Update Menu.
If the option is selected in the Map Window, the Auto button will show the Map Window and begin updating it automatically with recent spots.
The Auto button will also begin retrieving WWV data from DX Summit, HB9DRV and the NOAA web site.
The green AUTO button becomes a red STOP button when in automatic mode. Pressing the STOP button will stop automatic operation.
Press one of the 25, 250, or 1000 buttons to manually retrieve recent DX activity from DX Summit. Use the Update menu to retrieve spots from other sources. This is not necessary if you have pressed AUTO.
The status of DX Monitor’s interaction with various web sites is displayed
in the status bar at the bottom of the window. Error messages may appear at the lower right.
If a response is not received from DX Summit or another site, DX Monitor will attempt to
contact www.google.com. If this is unsuccessful, the program will display the message:
No connection to internet.
Tip: If you have just connected to the internet, or if your connection has been interrupted and restored, force an immediate update by pressing the STOP button, then pressing the AUTO button. |
Some tasks stop automatic operation because they may cause a conflict within the program. Retrieveing
10,000 spots from DX Summit is one of these operations.
![]() Map Button.
Map Button.
If Automatic Refresh is checked in the Map Window Plot Menu, the spots will be plotted on the map.
If the Automatic Wallpaper option is
checked in the Options Menu of the map, the map will be displayed on the
desktop as it is updated.
To announce a rare DX station
Please do not "test" spotting without entering a real DX station that
you can hear. Please use your own call to make announcements.
Avoid using the spotting network to send comments or ask questions which
should be sent as announcements.
![]() Hot Spots Button
Hot Spots Button
Tip:
Double click on a callsign in the
History Window to see the actual spots for that station.
Go back to the Hot Spot list with the
|
24 Hour Button
. Press this button to see the past 24 hours displayed in the History Window. If you have not had DX Monitor running and it is a busy day, you may need to download more spots to see a complete 24 hours. Use the Get 10,000 Spots command in the Update Menu to fill in the blanks. Once the spots are displayed, press the Map Button to see them on a map, or use the What's Hot command inthe Show Menu to see the most popular spots in the 24 hour period.Press the ANN
button to view the latest 25 announcements. If you wish to make an announcement of your own, fill in the bottom line of the Announcements form and press the Send button, or the Enter key.
![]()
![]()
Recent WWV numbers are displayed on the toolbar. The color indicates the trend. Green
indicates improving conditions. Red indicates worsening conditions.
Move the cursor over the numbers to see the date and time they were posted.
Click on the numbers to
view graphs of the trends in the
solar flux and geomagnetic indexes.
If the panel is blank, there is no recent data to display. Click on the panel to
show the WWV Window and use the Update Menu to
retrieve new information from DX Summit or HB9DRV.
The current UTC time
Press the little door to exit the program.
DX Spot Display Grid
In normal operation, new spots appear near the top of the main grid as it is sorted in reverse order by time. It is possible to sort the grid in any order by clicking on the header at the top of each column.
When the grid is sorted in a different order, you will not see new spots appearing which
are sorted off the window. To remind you that the grid is sorted, the headers appear in
red if they are not in reverse time order.
Spots with corrected times ©
The spot time is sent by the DX cluster from which the spot originated. Some
clusters have their clocks set incorrectly. If a spot is received for a time
which is in the future, the time is "corrected" to the current time and the
© symbol is displayed beside it in the comment field.
Click
Clicking on a callsign may optionally perform several other tasks.
If the option is selected, a left click will bring up the popup menu which normally is shown with a right click.
Tip: Double click is user defined by the User Preferences. Make it do what you want it to do. |
Double Click on a call to search the call in the History Window and show all of the spots made for that station which are in the DX Monitor History file.
Double clicking may also perform one or more of the optionally selected tasks:
Display the Callbook data in a popup window.
Display QRZ information in your web browser.
Tune your rig to the frequency of the spot.
The operation of double clicks is defined in the User Preferences window.
Double clicking on a URL in the comment column will launch your web browser and connect to the page in the comment.
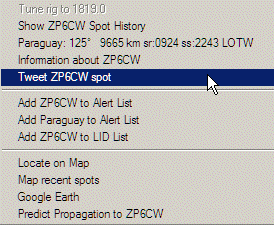 Popup Menu
Right-clicking on a callsign in the grid will bring up a popup menu with information about the station. The country, beam heading, and sunrise and sunset times are shown.
Clicking on Tune Rig will tune the rig to the selected frequency if the OmniRig rig control option is enabled.
Clicking on Show Spot History in the popup menu will open the History Window and display all of the spots of this callsign as well as spots made by the station. See the History Help Page for how to make the most use of the History Window.
Clicking on the named country and beam heading, will show the history of all DX spots from the same DXCC country as the station selected. The beam heading, distance, sunrise and sunset and Logbook of the World status are also shown.
Tweet Spot allows you to send the selected DX spot to your twitter friends, who may be reading twitter on their mobile phone. This is the perfect way to brag about the DX you just worked while they are slaving away in the office.
Clicking on Information about ... will show the Station Information Window with Callbook or FCC data. You can press buttons to find more about the station from QRZ, HamCall, Google, Google Maps or Google Earth. The information will be displayed in your web browser. Notes can be saved about any station.
You can add the specific callsign, or all stations from that DXCC country to the Alert List by selecting from the popup menu. This will bring up the Alert List Edit Window allowing you to modify the entry before adding it. If the call or country is already in the alert list, the menu will change to Remove from the Alert List.
A callsign can be added to the Lid Filter by clicking on the Add callsign to Lid List in the popup menu.
Locate on Map will place a marker on the DX Monitor map showing the location of the station.
Map Recent Spots will show the recent spots on the map for this station.
See the Map Window for more information on mapping and choosing the type of map, color combinations, and other options.
Google Earth will show the general location of the station using the Google Earth application. For a more accurate location of stations based on the street address, use the Station Information Window.
Check Propagation. Use HamCap and VOACAP to check the propagation between your location and the DX Station and display the information in a chart.
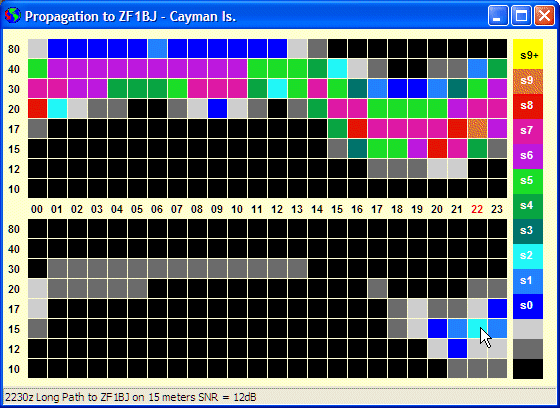
Propagation to the DX from your location
The top grid shows the predicted signal strength on the short path. The lower grid shows the long path prediction. The color code is shown at the right for various signal strengths above noise. The strengths are based on the antennas specified in the HamCap program.
Move the cursor over the grid to read the expected signal strength in the status bar at the bottom of the window.
If the Main Window - Double Click Shows Propagation preference is checked, double clicking on a callsign will show the propagation chart.
User Defined Options. If a User Defined Interface is
enabled, it can be chosen from the popup menu.
The File Menu
The file menu
Clear Grid. Clear the display grid. The grid will be refreshed from the current data in the database if any is recent enough to display.
Save Grid ctl-S. Save the grid file to DXSPOTS.TXT. The file can be loaded into Excel and other spreadsheets as it is in tab-delimited form.
Save Grid As .... Save the grid file with a different name.
Autosave Grid on Updates. If checked, the grid is saved to a file. The name of the file is the last name assigned using Save Grid As. Most users should leave this unchecked. The only reason to enable this feature is to save a file for your personal use. For example, you could use the data to create a web page for your locality that includes the beam heading and propagation information. Or you could add features that are not available in DX Monitor at this time. If that is the case, let me know. If it is a feature that others would want, it should be added to a future version.
Save Profile .... Save the current preferences as a new profile. If you use DX Monitor for both VHF and HF DXing, you may wish to set different filters and spotter ranges for each session. This allows you to switch among multiple profiles. Profiles are saved as *.ini files in the DX Monitor folder and are copies of the default dxmon.ini file used to configure the program at startup. Use names like VHF, HF, WARC, Top Band, etc. for the profiles you create.
When you save the curent settings as a profile, the optional windows will close and re-open. This ensures that various settings such as window placement and size are saved properly in the profile.
Use Profile. The submenu will list the available profiles that you have created. Selecting Reset to Default Preference will reset all the user preferences (except your email address and serial number) to the factory defaults. This is the same as Help Menu | Reset.
Previous returns you to the settings before the last profile chosen.
Restore 05-12-31 1047. When you select Reset to Default, a backup restore profile is created. You can return to that profile by selecting one of these restore points. If you have reset to default multiple times, you can clean up this menu by deleting the files like Restore 05-12-31 1047.ini.
Exit. Shut down DX Monitor. The door button at the right of the toolbar also closes down
DX Monitor. It is important to close DX Monitor before closing Windows.
The Edit Menu
Enable Editing Ctrl+E. In order to prevent accidentally changing the display by inadvertently typing a few keys, the grid is normally locked. This command unlocks the grid for editing. Editing the grid does not change the underlying data. It is only useful if you wish to save a grid of data for some other purpose. Most users will not need or want to edit the grid.
Note that if you are connected and new spots are arriving, changing the display of a spot will most likely result in it being changed back as soon as the new data arrives.
Find Ctrl+F . A search dialog will pop up into which you may enter a callsign. The program will search the grid for the first appearance of the callsign. The History Window will also be displayed and all of the spots of that callsign will be displayed in reverse chronological order. If the Recent Button is enabled, only the past week’s spots will be shown. Press the button to show the rest of the historical spots.
Find Again F3 will search for the next entry in the grid.
Delete Grid Row Shift-Del. Pressing the Del key while holding down the shift
key will delete a row from the grid. This does not delete the data from the History Data File.
To delete data from the history file, use the Del key in the History Window. In general,
it is pointless to delete a record until you are sure it won't be retrieved again from one of the
data sources.
Update Menu
Automatic DX Summit Download. If checked, the DX Summit web page is checked every few minutes as set in the User Preferences F10. Note that the refreshing of the main window display is independent from the retrieval of data from DX Summit, Telnet and other sources. Even when not connected to the internet, old spots are deleted as they expire based on the Grid Show Latest x Hours option.
Pressing the green Auto Button will select both Automatic DX Summit and Automatic HB9DRV downloads.
When automatic downloads are enabled, the green Auto Button changes to a red Stop Button which can be used to stop automatic retrieval operation. This is useful if the display is changing while you are trying to examine something.
Get 25 - 1,000 Spots retrieves data from DX Summit and is the same as the 25, 250 and 1000 buttons.
Get 10,000 Spots from DX Summit will retrieve the last 10,000 spots. This is normally about 750K of data and can cover 2 to 3 days of normal operation or a few hours of CQWW. When retrieving 10,000 spots, Auto is disabled and you should refrain from using DX Monitor until the import of the data is complete. If you are using DX Monitor for the first time, retrieving this data will make the History Window and Map functions more interesting.
Check for Gaps in History File will check the last 10,000 entries of the History File. If there are any ten minute periods with no spots, they will be shown. If there are gaps, you will be given the option of downloading the 10,000 spot page from DX Summit. If you have recently downloaded 10,000 spots, the program will only check the period since the last successful download.
Tip: If you want to collect a complete database of DX Spots for searching, use the Check for Gaps command every day after DX Monitor has completed its normal automatic download of 250 or 1,000 spots. |
Get HB9DRV DX Spots retrieves latest 50 spots from the HB9DRV DX Cluster on the web. The same information is available by Telnet to HB9DRV.
Automatic HB9DRV Downloads retrieves the spots from HB9DRV at the repeat time set in the User Preferences. (Defaults to every 1 minute).
When automatic downloads are enabled, the green Auto Button changes to a red Stop Button which can be used to stop automatic retrieval operation. This is useful if the display is changing while you are trying to examine something.
Get 50 or 250 HB9DRV DX Spots. Manually retrieves data from HB9DRV.
Refresh Grid. Refreshes the display grid based on the data now available in the program.
Refresh Grid Regularly. If checked, the grid is automatically refreshed every 15 seconds.
Use this menu to sort the display of current data in the grid. Clicking on the column headers also performs a sort. Clicking again reverses the current sort order of a sorted column. The default sort order is descending by time.
Ascending/Descending. Order in which to sort.
Sort by Spotter, Frequency, DX Call, Comment, or Time. Sort the grid. The sorted column header turns red to remind you that the grid is sorted. New spots may not be visible if they are sorted into a location off the screen.
Click the Time header to return to normal sort order. It may be necessary to click twice if the first click results in an ascending sort.
Sort by Beam Heading. If the Show Beam Headings option is turned on, you can sort the DX spots by beam heading from your location. You can also sort by clicking on the column header for the beam headings.
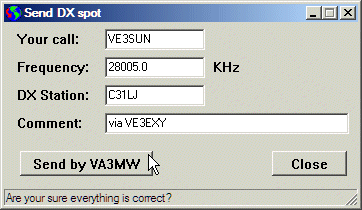 Send DX Spot. A small window pops up allowing you to send a spot via
a Telnet server. Enter the callsign of the DX station, the frequency in KHz, and a comment.
Press the Send button to send via Telnet.
If you are not connected to a Telnet Server, the Spot Button will display the DX Summit spotting page in your web browser.
Before sending the spot, DX Monitor will verify that the callsign appears to be a correct call, having at least one digit and one letter, and that the frequency seems to be in the correct format. The program will also check to see if there are any other spots for that station within the past 30 minutes. If so, you will be warned and allowed to cancel the spot or send it. You may, for example, want to send it to a local Telnet cluster that has not received it via its own connections even though DX Monitor has retrieved it from another source.
The Spot button on the toolbar is equivalent to this menu item.
Send WWV Announcement. If you are connected to a Telnet Server, you can send a WWV announcement to the telnet cluster. Fill in the form with the SFI, A, and K values plus any comment that you wish. Most clusters now get the WWV information automatically via their own connection.
This menu item is equivalent to the Announce button in the WWV Window.
Set DX Alerts F4. Display the Alerts Window. This Window is listed in the Window Menu and also available on the right-click Popup Menu.
Set Skeds. Display the Skeds Window. This window can also be shown by clicking on the clock.
Real Time Google Earth Shift-F5. The most recent spots will be sent to the Google Earth application for display. Google Earth will fly from one spot to the next as they arrive. This is a screen saver type of view as Google Earth will refresh every 20 seconds, taking control from any other active window. It makes a great demonstration of ham radio and a wonderful geography lesson. A broadband connection and a powerful computer are recommended for full enjoyment of this option.
The FCC Database should be installed to provide location information for US and Canadian calls.
Clicking spots on the map will show the time and frequency of the spot. Adjust the Google Earth options for the speed of travel you find comfortable and the density of other information on the images. Press F11 for a full screen view.
If the OmniRig rig control option is enabled for tracking Real Time Google Earth spots, your radio can follow the spots as they are shown on the satellite images if you enable monitoring.
Monitor Incoming Spots (Shift-F3). If OmniRig is enabled, your receiver will tune from spot to spot as they are received. If you enable Read Time Google Earth, the stations will be tracked on Google Earth images.
This is intended to be a screensaver/demo mode. For more practical monitoring of DX stations,
use the Scanning Tools in the Band Map Window.
Options Menu
Select Filters and Colors. The display colors and the frequencies which are hidden or displayed are determined by filters which are selected by this menu. Each filter is saved as a separate file (e.g. HF CW.fil. The names of the available filters are displayed in the submenu. The current filter in use is shown in the panel at the bottom right of the window.
Filters included in this release are:
|
Edit Filters... displays the Filter Editor which can be used to change the settings of the filter in use, or to create a new filter. See the Filter Editor Help page for more help on using the Filter Editor.
Create Filter Speed Button. Create a speed button on the menu bar for the current filter. To create a speed button for one of the filters, first select the desired filter from the Select Filters and Colors menu list. Then click on Create Filter Speed Button. You will be prompted to enter a caption for the button, which will appear to the right of Help in the main menu. Clicking on the speed button will change the filter immediately.
If a speed button already exists for the current filter, this menu item will change to Delete Filter Speed Button,
which can be used to remove a speed button from the menu bar.
Country Filter
Country Filter - Enable. Enable or disable the Country Filter.
Country Filter - Edit Filter. Use the Country Filter Editor to edit the list of countries included or excluded when the country filter is enabled.
Show All Alerts (Ignore Filter). If checked, this option tells the program to ignore the filter when a DX station listed in your Alert List is spotted. If not checked, you will only see the alert if the frequency is within the selected filter range.
LID Filter. The LID filter is used to block posts from or about certain callsigns.
Right click on a callsign in the main grid and use the Add to Lid List command to add the offending callsign to the Lid List.
Enable Lid Filter. When checked, the Lid Filter is enabled and spots will not appear in the main grid. The spots are still kept in the History.
Edit Lid Filter. Shows the Lid List for editing. Lid List Options allow you to apply the filter to the Spotter and/or the DX column.
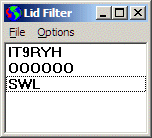
The Del key can be used to delete a Lid from the list.
Right click on a callsign in the Lid List and select Show History to show all the spots that have been made by or about that callsign. This is particularly useful for the case of SWL. Unfortunately, a lot of offending spots are posted with the spotter listed as SWL. However, real SWLs also post useful spots. In general, it is better to block the real callsigns such as IT9RYH.
Highlight Spots Near Terminator
Note that looking up the sunrise and sunset times for each station can require some time and cpu cycles. This is not a problem with a high speed modern computer, but might slow down an older model. If the FCC database is installed, it is used to locate US and Canadian stations.
Currently, only spots for frequencies lower than 10.2MHz are shown because it has been my experience that the GreyLine Effect is most pronounced from 160 to 30 meters. Would you like to see that frequency changed? Please let me know.
Highlight LOTW DX
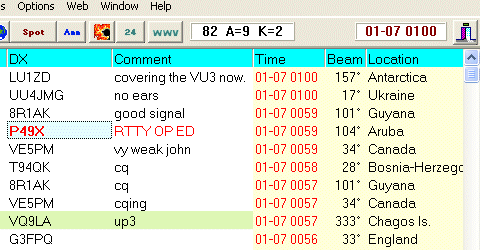
Show Beam Heading. If checked, the beam heading is shown in a new column. If you have a vertical or a slow computer, leave this option off and the window will refresh more quickly.
Show Location. The submenu offers the choice of Country name, DXCC Entity prefix, US State, or US County. If one of these options is chosen, a new column is displayed on the right containing the desired information. A mixed option can display US County and Country for non-US stations.
In order to display the state and county information, it is necessary to install the FCC database. Each call is looked up in the database to determine the state and county information. This option is not recommended for slower computers or computers with small memory.
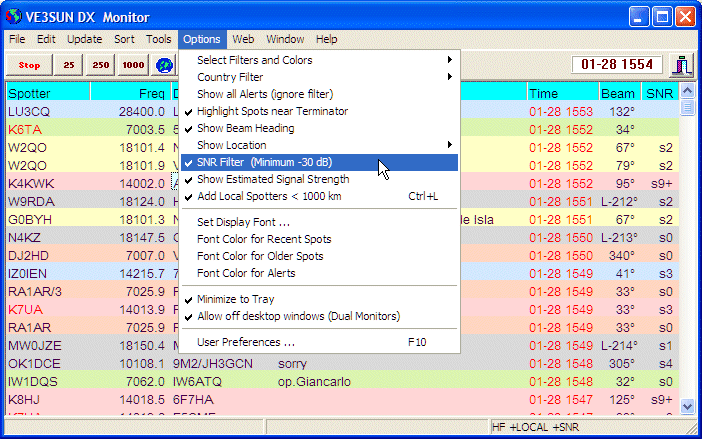
Main Window showing only workable stations
SNR Filter. Enable filtering of the display based on signal strength. If enabled, only stations predicted to be stronger than a minimum signal to noise ratio will be displayed. You will be prompted to change the minimum strength when you enable this option. The default is -20dB. In order to use the SNR Filter, HamCap must be installed and enabled.
Propagation is only predicted for 80 through 10 meters. If the SNR filter is enabled, no spots will show for 160 or VHF stations.
If the SNR Filter is enabled, the Local Spotter Filter changes function. Selecting Add Local Spotters will show spots from spotters close to you, even if the propagation is not predicted to be good. That way, you won't miss the surprise openings.
Tip: Enable the SNR Filter and Add Local Spotters to see the DX on 80 through 10 that you have a good chance of being able to work. |
Show Estimated Signal Strength. The SNR column will be displayed. The SNR has been converted to s-units above the noise level. If the propagation prediction has not completed, a ? will be shown. If the estimated signal to noise ratio is less than -20dB, the column will be blank. Propagation is only predicted for stations on 80 through 10 meters. 160 and VHF spots will not show a signal strength figure.
Local Spotters Only. If this option is selected, the only spots you will see are those from spotters within the range set by the User Preferences | Options Tab | Local Spotter Range. For quick access, pressing ctrl-L toggles this option so you can see the locally spotted DX and the total DX available from the world-wide network of spotters.
If the SNR Filter is enabled, the menu changes to say Add Local Spotters and local spots will be shown regardless of predicted signal strength.
Set Display Font lets you select the font to display the text. It is not necessary to use a monospace font. The font size may be changed to make the display easier to read.
Font Color for Recent Spots. Select a different font color to highlight newer spots. The time considered “recent” is set in the User Settings F10. If you are using No Filter, the default color will be saved. Otherwise, the Filter Editor window will appear and you will be able to change the color for the current filter.
Font Color for Older Spots. Select a font color to use for the older spots. If you are using No Filter, the default color will be saved. Otherwise, the Filter Editor window will appear and you will be able to change the color for the current filter.
Font Color for Alerts. Select a color scheme to use for stations that are listed in the Alert List. The default is red on a white background.
Set Selection Background Color. Set the background color that will be used when an item is selected. This is useful if you have created customized filters with light colored text.
Minimize to Tray. If checked, minimizing the main window (clicking the small bar box at top right corner), will move DX Monitor to the background and place the DX Monitor icon in the system tray, usually at the bottom right of your screen. Clicking the icon will restore the program. Hovering the mouse over the icon will show the number of recent spots unless an alert has sounded, in which case, the callsign and band of the alert will show.
While minimized, it is possible to run the map function with the Copy to Wallpaper option enabled so that new spots are shown on your desktop.
Right-click on the icon in the system tray for a popup menu. Restore will restore the application to the normal view. Exit will shut down DX Monitor.
If you try to run another copy of DX Monitor using a shortcut on your desktop or from the Start Menu when it is minimized,
the running program will be restored to normal view and the new one will not be run.
Pause HamCap Background Calls
User Preferences F10. Show the User Preferences window used to set preferences and options for the program.
For your convenience, a few URLs to the DX Summit site have been hard coded into the DX Monitor program. These are listed under the Web menu. Selecting any item on this list will tell your default browser to load the selected page. If you suspect that DX Monitor is not working, it is a good idea to check DX Summit directly to see if the server is temporarily down.
Telnet. Show the Telnet Window and optionally connect to a Telnet Server Automatically. See Telnet Window for details. Select a server or More ... to see the complete list.
If the Telnet windows are hidden, the Show All Hidden Windows will display them.
Close all Telnet Windows will sign out of each server and close the windows.
Band Map Ctrl+B
History Window F9. Show the History Window.
Maps F2. Show the Maps Window.
Alert List
WWV History. Display the WWV Window. Press the Esc key to cycle through the displays of graphs and tabular data. Filter Editor. Show the Filter Editor.
Station Information Window F11. Display the Station Information Window. If a callsign is selected in the grid, the information will be displayed. Or, you can enter a callsign to look up data in the Callbook by pressing the Find button.
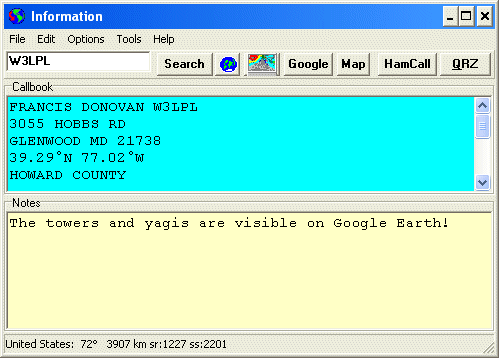
From the Station Information Window you can press buttons to retrieve web pages from Google, QRZ and HamCall. Notes can be attached to a callsign which will be displayed when you return to this window.
HamCap Application Ctrl-F9. Shows the HamCap Application. Useful for looking at the propagation maps or changind settings in HamCap. When HamCap is shown, background calls to HamCap are suspended for 1 minute. SNR values will not be calculated for new calls showing up in the Band Map or Main Window. To suspend background HamCap calls for longer than 60 seconds, use the Pause HamCap option.
Announcement History. Display the Announcement History Window showing recent announcement messages received from DX Summit. You may send an announcement. If you are connected to a Telnet server, you can send local and full announcements from the edit line in the Telnet Window.
Skeds and Alarms. Show the Sked List. Click the UTC clock to show the same window.
Check Computer Clock. Show the Internet Time Window which allows you to check the correct time and correct your computer’s clock if necessary.
The manual for DX Monitor is provided in html format. Links to the manual pages are provided on the Help menu. The pages are displayed on your default browser.
Search .... Search the Help pages for information. Enter one or more words to search for.
Paragraphs from the manual containing the search word will be shown in your web browser. The words will be highlighted in yellow. An icon at the top of each section indicates where on the page the extracted paragraph came from. Click on the header to go to the original document.
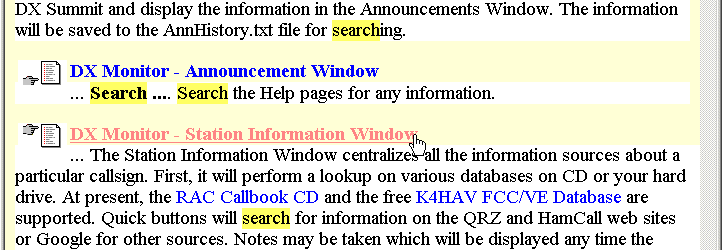
Search results for the word “search”
Tip: Search for Tip: to see all these tips in the help files. Help | Search | Tip: |
Contents. Quick link to the Manual Table of Contents, chapter by chapter.
Introduction. Read the manual through at least once to discover the features that aren't obvious. Overview of the program features, installation instructions and some examples are provided.
Help for Main Window F1. Specific Help for the Main Window of DX Monitor. All Windows have specific help available by pressing the F1 key.
FAQ. Frequently asked questions.
Reset all Options and Preferences. There are a lot of options and preference settings and sometimes it is possible to set it up so that few or no spots are appearing, which can make it look as if DX Monitor is no longer working. This option clears out all the user settings and preferences to the original state. Only the owner callsign and registration serial number are retained. This is the command of last resort when you can't figure out what is going wrong.
If reseting all the options does not fix a problem you are having, the best thing to do is
reinstall the program in a new folder. Write down your serial number (which is associated with
the callsign) as shown in the User Preferences. Delete the folder from which you are running
DX Monitor. Install DX Monitor again from the downloaded zip file. It is also possible to
install DX Monitor in a different folder so that you don't delete the old information.
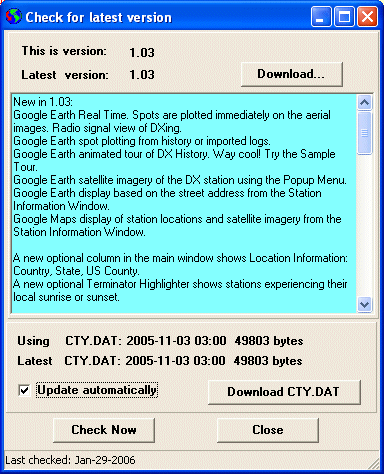 Check for Updates...
The date of the CTY.DAT file on your computer should be the same as the latest CTY.DAT file.
The Update Automatically checkbox refers only to the CTY.DAT file. If checked, the latest file will be downloaded and you will be alerted that you need to restart DX Monitor before the new prefixes take effect. You will also be able to copy the CTY.DAT file to your CT folder if you use that program or any other program which uses CTY.DAT to determine countries from prefixes.
Bug Reports and Feedback.... Takes you to the web form for reporting bugs or making suggestions using your web browser.
Join Support Mailing List. A Yahoo Group has been set up for DX Monitor users to share ideas for improving the program and to help new users with problems. Members hear about the latest versions first and have the opportunity to test beta releases before they are made public. Click to Join. Or send a blank email message to: dxmon-subscribe@groups.yahoo.com
Register DX Monitor. DX Monitor is shareware. It may be used for a few weeks without registration to test its features and ensure compatibility with your system. After the trial period it is necessary to pay for DX Monitor and receive a serial number which will allow it to operate. Register Now.
DX Monitor Home Page. Check here for the latest FAQ and information about DX Monitor.
About DX Monitor... will display the DX Monitor copyright information and some information about your system.